
Statistical Notes
Total Numbers. —
A total of 46,071,604 persons were enumerated in England and Wales as at midnight on Sunday, 23rd April, 1961, according to the preliminary summaries furnished mainly by Enumerators. Of this number 22,298,899 were males and 23,772,705 were females. This actual (or de facto) population included all persons enumerated on land. In all craft in inland waters, and in every vessel which at midnight on Census Day was in port, or at moorings or anchorage in England and Wales, or engaged in any coastwise or fishing voyage, and which arrived in port later (in this report an adjustment has been made to take account of fishing vessels still at sea when the Tables were compiled). Ships of foreign navies were excluded. Members of the Armed Forces, of the Merchant Navy, or civilians, overseas are not included in the enumerated population which thus corresponds to the home population of England and Wales as defined and estimated at each mid-year and published in the Registrar General's Statistical Review and the Annual Estimates of Population. *
Including losses of 577 and 240 thousands of non-civilians and merchant seamen belonging to England and Wales who died outside the country 1914-1918 and 1939-1948 respectively. Changes since 1951. —
As Table A shows, the population of England and Wales has increased, since the last census in 1951, by 2,314 thousands. This is more than in any previous ten-year intercensal period since 1901-11. The table shows also that this larger addition to the population is mainly attributable to a rise in the flow of births. In the intercensal period 1951-61 there were 7,121 thousand live births, rather more than in the period 1921-31, and a considerably larger flow of births (allowing for the different time interval) than in the twenty years 1931-51. As is to be expected in an ageing population, deaths at 5,159 thousand were also higher than in any corresponding period since 1911-21. Nevertheless the natural increase (excess of live births over deaths) amounted to 1,962 thousand. In addition there was a net gain by migration from other countries of 352 thousand. The intercensal movements are analysed in more detail in Table B, in which the population change between mid-1951 and 1961 is analysed into the separate components of births, deaths and net migration. It will be seen that an upsurge in the flow of births occurred in the year 1956-57 and that stability has not yet been achieved. Much of this increased flow of births is a matter of acceleration due to earlier marriage and the tendency to concentrate the bearing of children earlier in married life, and to this extent it may not be maintained. Some permanent increase will remain if there has also been some significant increase in average family size (in terms of the total live births ultimately produced by a married couple). It is a fact that this figure moves only slowly with changes in social attitude and it will only be when the marriages most involved in the recent rise in births have been in existence for ten years or so, that it will be possible to make a firm Judgment on this score. Whether a permanent rise or not, live births in 1960-61 were 18 per cent above the level of 1951-52, the first year of the period. Deaths have naturally fluctuated with the incidence of influenza and other waves of respiratory infection, but there has been no pronounced trend. With deaths thus generally stable and births rising, the natural increase has risen from an average level of 180 thousands in the first three years of the period to an average of 235 thousands at the end of the period. Another significant event has been the reversal in direction of net migration which since 1954-55 has been increasingly inward. For most of the intercensal period the net migration, whether outward at the beginning or inward later, has been trivial in relation to natural increase, but since 1959 the gain in number from the excess of immigration over emigration has risen and in 1960-61 is estimated to have exceeded the excess of births over deaths. This has not happened since the inward rush of refugees and repatriation immediately prior to World War II. DIAGRAM A. CENSUS POPULATIONS AND INTERCENSAL ESTIMATE
Intercensal Population Estimates. —
The 1961 Census provides a new bench-mark For annual population estimates in the years that intervene until the next count is taken. At the same time it serves to indicate the degree of precision of estimates in the immediate past. These estimates have been plotted in Diagram A which shows that the 1961 Census figure fits consistently into the estimated trend. The normal methods employed by the General Register Office would have produced an estimate at Census Day of 46.051 millions, an accumulated shortfall (according to these provisional figures) over ten years of 21 thousand or one half of one per cent. Having regard to the information available about migration this result must be regarded as satisfactory and as broadly validating the estimation methods. Density. —
The density of population in England and Wales is 790 persons per square mile of land (and inland water). There is only one other major country in Europe, the Netherlands, which is more crowded with 893 persons per square mile (1958). The figure for Belgium (1958) is 769. Outside Europe even Mauritius which has been the subject of two recent reports calling attention to its population pressure is not so very much more densely populated at 839 to the square mile (1958) though its economic situation is not comparable.1
Taiwan is regarded as crowded but here there are fewer persons per square mile (710) than in England and Wales. Japan has 642 per square mile (1958). India has 313 per square mile, Mainland China 156, and the United States a mere 49. These global figures conceal wide variations within countries, between urban and rural areas, and between inhabited areas and the vast stretches of uninhabitable mountain or desert which in some countries artificially reduce the density index, but they serve to emphasise what is visually obvious to those who travel in England and Wales, that we live close together. Geographical Variation in Population Growth. —
Table C compares the average annual percentage growth in the periods 1931-39, 1939-51, 1951-61, for different regions, and for the parts of these regions that fall within and outside the major conurbations. The constitution of these regions is shown in Appendix A. The average annual increase in the 1951-61 period has varied widely from 1.88 per cent in the Eastern region and 1.44 per cent-in the Southern region to .16 in Wales. There are a number of regions, the Northern, North Midland, Midland and South Western, where the rates of increase were either a little below 6r a little above the national average of .51 per cent. In the East and West Ridings (.17), North Western (.19), London and South Eastern (.17) the rates were well below the national average. Within the London and South Eastern region, the Greater London conurbation actually suffered a decline in population of some 176 thousand mainly by movement outward from the centre to more open areas elsewhere in the region (which increased its population by an average of 1.33 per cent, nearly as fast a rate as that of the Southern region) or in neighbouring regions. Of the other conurbations only the Tyneside and West Midlands show any substantial increases in population. In many cases these rates are similar to those in earlier periods, but there has been an acceleration in population growth in the Northern (especially in Tyneside), Eastern and Southern regions, and a retardation in the rate of growth of the population in the Midland, London and South Eastern, and South Western regions.(though war time movements obscure the picture in London). Where the rate of increase is below the national average the gain from an excess of births over deaths must be outweighed by migration losses and vice versa. So it may be deduced from the rates of increase in Table C that there has been a continued general movement of population from the North of England and from Wales to the South especially to the Eastern and Southern regions, with some side gain to the northern parts of the Midlands. Counties. —
Table 4 which relates to the counties with their associated County Boroughs makes it possible to give more definition to this movement. It is seen that the larger population expansions have occurred in counties close to London, notably Hertfordshire, Bedfordshire, Buckinghamshire, Berkshire, Oxfordshire, Surrey, Kent and Essex; in counties bordering the English Channel, again Kent, East and West Sussex, Hampshire, and to a lesser extent Dorset; in counties of East Anglia especially Huntingdonshire, Peterborough and Cambridgeshire; in the midland counties of Lincolnshire (Lindsey), Nottinghamshire, Leicestershire, Rutland, Northamptonshire, Staffordshire and Worcestershire (Northamptonshire and Bedfordshire may be looked upon as a bridge between the Midlands and London); and in counties surrounding the Severn Estuary, Gloucestershire, Wiltshire and Somerset. Among counties which have not kept all their natural increase (excess of births over deaths) or which have actually suffered a decline in population are Northumberland, Cumberland, Durham, Westmorland, Yorkshire (North, East and West Ridings), Lancashire, Cornwall and all counties in Wales. (The drain of population from the Administrative County of London is discussed separately below). Towns. —
It is possible to go still further with the help of Table 5 and consider the population changes of the larger urban authorities (those with a population of 50,000 or more), As part of the general North to South redistribution, substantial increases of population occurred in Hemel Hempstead M.B. and St. Albans M.B. in Hertfordshire; Bedford M.B. and Luton M.B. in Bedfordshire; Coulsdon and Purley U.D., Esher U.D., Guildford M.B., Reigate M.B. and Woking U.D. in Surrey; Gravesend M.B., Maidstone M.B., Orpington U.D., Rochester M.B. in Kent; Southend-on-Sea C.B., Basildon U.D., Brentwood U.D., Chigwell U.D., Colchester M.B., Harlow U.D., Hornchurch U.D., Romford M.B., Thurrock U.D. in Essex; Crawley U.D., Worthing M.B. in Sussex; Bournemouth C.B., Southampton C.B., Fareham U.D., Havant and Waterloo U.D. in Hampshire; Poole M.B. in Dorset; Peterborough M.B.; Cambridge M.B.; Ipswich C.B., in Suffolk; Lincoln C.B., Scunthorpe M.B. in Lincolnshire; Beeston and Stapleford U.D. in Nottinghamshire; West Bromwich C.B., Aldridge U.D., Brierley Hill U.D., Newcastle under Lyme M.B. in Staffordshire; Cheltenham M.B. in Gloucestershire; and Swindon M.B. in Wiltshire. In counties with a net outward migration, actual leases were sustained by Newcastle upon Tyne C.B. in Northumberland; Darlington C.B., Gateshead C.B. in Durham; Barnsley C.B., Dewsbury C.B., Halifax C.B., Sheffield C,B., York C.B., Keighley M.B. in Yorkshire; Barrow in Furness C.B.., Blackburn C.B., Bolton C B., Burnley C.B., Liverpool C.B., Manchester C.B., Oldham C.B., Preston C.B., Rochdale C.B., St. Helens C.B., Salford C.B., Southport C.B., Warrington C.B., Wigan C.B., Ashton under Lyne M.B., Stretford M.B. in Lancashire; Merthyr Tydfil C.B., Rhondda M.B. in Glamorgan. Not all these losses were associated with the main drift, since in part they are due to the normal movement outward from larger urban centres to more open housing in leas developed surrounding areas, as the core of the town becomes more commercial. The general picture is of a continued movement of industry to the south, or drift from the coalmining and textile areas of .the north, growth of population in areas of the midlands where iron and steel, brickmaking, chemical industries are thriving, industrial expansion in southern areas with good communications with London or around south coast ports; a movement of dormitory areas further from the centre of conurbations, especially from London, as transport facilities have been extended by railway electrification schemes; and as an aspect of an ageing population a filling up of south coast retirement areas. *
For the purposes of this table the County of London is reckoned as an Urban area. Urban and Rural Areas. —
There is always a great deal of interest in dividing the urban and rural segments of the population. The sociological approach to this problem is to define the urban population in terms of the characteristics of town living i.e. the closeness together of dwellings, the appearance of distinct street formation, the emergence of a population cluster or group forming a unity indicated by social and economic interdependence in their daily lives, Evidence of this interdependence is to be found in the relationship between the various industries which sustain the community especially the balance between productive or distributive and service activities, the recognition of a common administrative and cultural centre, the common use of educational, religious, medical or postal institutions or of transport services. For census purposes only an approximation to this approach can be made. The primary object of the census is to meet the essential demographic needs of central or local government and the unit of enumeration must be designed to fit the boundaries of local authority areas. In the course of time these boundaries change to encompass the geographical spread of communities but the process is not continuous; it consists of steps separated by relatively long intervals of time. At. any one census while many local authority areas fit closely to real urban development there are others where the population unit as a cluster of urban growth has spread into a neighbouring local authority area. A special study was carried out at the census of 1951 (General Register Office, 1958) which distinguished as 'urbanised land1 any (urban) ward or (rural) civil parish of which any part, however small, was 'built up'. Land was regarded as 'built up' when it was assigned to density categories 1 and 2 (10 people or more to the acre) by the Ministry of Housing and Local Government when preparing their map of population density. Population living on this land was regarded as 'urbanised'. It was found that of the 31 and a half million 'urbanised' population in England and Wales more than half a million lived in rural administrative areas while of slightly more than 12 million non-urbanised population nearly 4 and a half millions lived in urban administrative areas. Thus there were more people living on non-urbanised land in urban administrative areas (County Boroughs, Municipal Boroughs, or Urban Districts) than on urbanised land in rural administrative areas (Rural Districts); an urban/rural dichotomy of the population in terms of local authorities produces a more 'urban' picture than would a more rigorous analysis. Nevertheless, rough though it may be the only dichotomy which the census can make (without some special supplementary analysis as in 1951) must be in terms of local authority areas. A summary in these terms is shown in Table D. Before discussing these figures it is necessary to recall that, as already indicated, the boundaries of towns change from time to time as and when the population growth encroaches upon the surrounding rural local authority areas to such an extent that it becomes necessary to give statutory administrative recognition to this growth and to adjust the town boundary to embrace it, if, as in the total growth index of Table D, the terminal urban population is expressed as a ratio to the initial population of the intercensal period, part of the growth implied by the index will be due to the inherent expansion of the population as such by births less, deaths and inward net migration and part to the acquisition of new and extended boundaries and the bringing in of people not originally part of the town population. In Table D these two elements have been separated in an approximate manner. With regard to the effect of boundary changes since 1911 these have been small relative to overall population growth for urban authorities except during the period 1931-39 following the review of boundaries under the Local Government Act, 1929. But in the areas of rural district councils where the population is more concentrated just in those areas to be transferred because they are 'urban' in character these transfers : have been relatively much more important especially in 1931-39. Within the connotation of 'urban' defined above the urban population had first exceeded the rural population at about the time of the 1851 Census and by the end of the century the population of England and Wales was rather more than three quarters urban, and one quarter rural. Up to 1939 the urban proportion slowly increased until four fifths of the population was included within the boundaries of urban authorities. The 1939 figures are based on local estimates and are of a different quality; too much should not be made of the apparent rise and subsequent fall of the urban proportion. It appears rather that stability was reached at this level. Since 1951 there has been little change in the urban proportion. The urban/rural aggregates analysis in Table E illustrates in another way the growth of urban communities beyond the confines of local government boundaries. The share of the total population disposed in rural districts and urban authorities outside the conurbations has increased at the expense of the share of the conurbations. Variations between Towns in Rates of Growth and Decline. — Table F illustrates the variability that exists in the pace of growth or diminution of urban populations. *
The 28 Metropolitan Boroughs and the City of London are here treated as separate districts. Altogether 644 urban areas or two thirds of the total show annual rates of charge upward or download of less than one per cent. In 20 urban areas the annual rate of increase exceeded per cent, i.e. enough to increase the population by two thirds on ten years. In 2 urban areas there was an annual rate of decrease of more than 3 per cent implying a loss of a quarter of the population in ten years. Some of these areas of relatively high rates of growth or decline of population are pinpointed below. Size of Town Populations. —
Table G shows the distribution of urban areas by size of population and the total population concentrated in each size category. In addition the overall percentage increase or decrease in the aggregate is shown for the period 1951-61. *
London Administrative County is here reckoned as one area. More than one half of the total population of England and Wales and about two thirds of the urban population are aggregated in 156 urban local authority areas of 50,000 or more population. The concentration is more intense even than these figures suggest, for more than one third of the total population (and nearly half of the urban population) live in the six major conurbations (Tyneside, West Yorkshire, South East Lancashire, Merseyside, West Midlands and Greater London2
). Greater London. —
The largest of these conurbations, Greater London, is the subject of more detailed analysis in Table H. The population still remaining within the boundaries of the combined areas' which form the conurbation of Greater London is less by 176 thousands than in 1951 and is slightly less than in 1931. Thus the whole of the increase between 1931 and 1939 has now been cancelled out by outward migration largely to outlying areas still within access of the Metropolis. The population of the inner core, the County of London, has declined both absolutely and proportionately even more, the loss of 153 thousands representing a reduction of 4.6 per cent of the 1951 figure, already much reduced by the permanent effects of the ebb and flow of World War II as well as the long term tendency for the growth of the commercial centre to encroach upon former residential areas. The population of the County of London has been declining since 1901, until 1931 quite slowly but thereafter the movement was accelerated even before the impact of War. The remainder of the conurbation, the so called Outer Ring which has taken the first strain of the outward pressure, has increased its population throughout nearly the whole of the period reviewed. The rate of increase was at first rapid; it was interrupted, as was all housing development, by two wars; latterly it has been almost at a standstill as the area has become fully developed. New Towns. —
In 1951 the then projected New Towns contained only small numbers of people in addition to the original nuclei. The 1961 picture (as shown in Table J) is very different. Aycliffe which had only 600 persons in 1951 has now grown to contain more than 12 thousand. Basildon has more than doubled its nucleus population of 1951 to reach a figure of 54 thousands. Bracknell has quadrupled its population, though it has still only 20 thousands. Corby already claimed 17 thousands in 1951 (in Corby U.D.) and has more than doubled this figure. Crawley, Harlow and Hemel Hempstead are now large towns of more than 50 thousand population; they had, respectively, only 11 thousand, 6 thousand and 22 thousands (in Hemel Hempstead M.B.) ten years ago. Hatfield has more than doubled its population of 1951 (mostly in Hatfield R.D.). Peterlee with only 300 in 1951 now contains 14 thousand. The population of Stevenage has grown from 7 thousand (in Stevenage U.D.) to 42 thousand. Welwyn already in 1951 contained 19 thousand persons living in Welwyn Garden City and the population has expanded to 35 thousand. In Wales, Cwmbran with 14 thousand at the last census (mostly in Cwmbran U.D.) has now 30 thousand. Since 1951 therefore some 300 thousand persons (including some born to immigrant families) have been accommodated in these areas of planned urbanisation; this is equivalent to the absorption of rather more than one year's growth in population of the country as a whole. Sexes. —
The ratio of females to males at the 1961 Census was 1,066 per 1,000. This compares with 1,082 in 1951. The ratio, for all ages combined has been falling. This is the net result of two opposing forces. On the one hand the preponderance of male births (enhanced by reduced foetal mortality which has hitherto operated selectively against males) is tending to lower the female/male ratio at younger ages, and on the other hand the failure of male longevity to improve as has female longevity means that at older ages there is an increasing excess of females. Figures for 1931, 1951, and 1961 are shown in Table K overleaf both for England and Wales as a whole and for various areal subdivisions. High female/male ratios are found in the London and the South Eastern region where employment of women is a predominant factor and in those counties associated with areas attractive to the retired and elderly among whom women are much superior in numbers. Counties with low ratios are mainly agricultural. More women than men tend to leave these areas for employment in the larger towns and especially in the Metropolis. An Important Reservation. —
Local authorities especially should bear in mind that the figures reviewed in this volume are not only the preliminary totals from enumerators' summary records which may be subject to correction when the household schedules have been fully scrutinised (the household figures in Table 2 are especially vulnerable in this respect) but are also the enumerated as distinct from the residential populations, i.e. they represent a count of persons actually in a particular area at midnight on 23rd April, 1961 irrespective of their usual addresses. The census date is chosen to minimise the number of people away from their usual address when enumerated but there is some movement which tends to inflate the populations of areas with more visitors than absentees. The local population estimates for mid-1961 when issued will be based on the census results with due correction for this movement (which will also be derived from census records). 1
'The Economic and social Structure of Mauritius'
J.E. Meade and others. London. Methuen, 1961. 2
See Appendix B for the Constitution of these areas.Part II Statistical Notes
Table A
Changes in Population by Births, Deaths and Migration, 1871-1861 (thousands)
England and Wales
Period
Increase in
populationBirths
Deaths
Natural
increaseNet
migration1871-1881
3,262
8,604
5,178
3,426
-164
1881-1891
3,028
8,894
5,265
3,629
-601
1891-1901
3,525
9,157
5,563
3,594
-69
1901-1911
3,543
9,290
5,246
4,044
-501
1911-1921
1,816
8,281
5,845*
2,436
-620
1921-1931
2,066
6,928
4,692
2,236
-170
1931-1939 (30 June)
1,508
4,969
3,985
984
524
1939-1951
2,298
8,330
6,263*
2,067
231
1951-1961
2,314
7,121
5,159
1,962
352
Table B
Estimated Mid-year Population and annual changes by Births, Deaths and Migration, 1951-1960 (thousands)
England and Wales
Year
(July to June)Estimated population
at beginning of year
(1st July)Change by
Home
Total
Births
Deaths
Natural
increaseNet
migration 1951-1952
43,815
44,007
669
484
185
-26
1952-1953
43,955
44,166
680
521
159
-24
1953-1954
44,109
44,301
681
488
193
-17
1954-1955
44,271
44,477
665
524
141
5
1955-1956
44,441
44,623
687
516
171
25
1956-1957
44,665
44,819
710
484
226
0
1957-1958
44,909
45,045
733
550
183
14
1958-1959
45,107
45,242
749
536
213
48
1959-1960
45,385
45,503
755
504
251
108
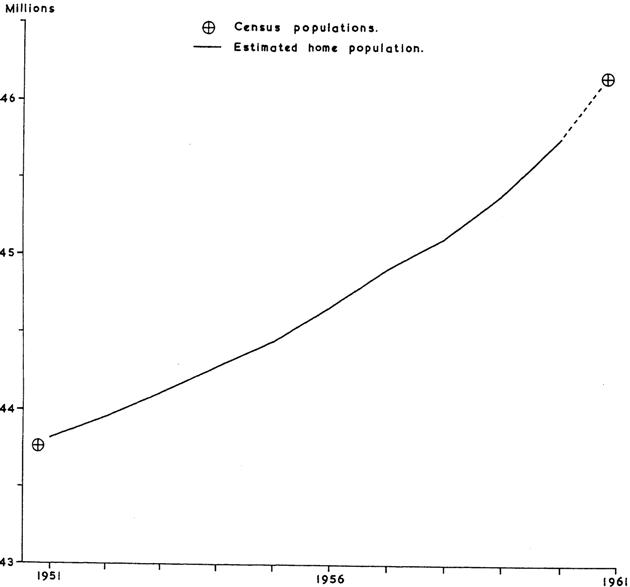
Table C
Population and changes
by Births, Deaths and
Migration, 1931-1961
England and Wales,
Regions and Conurbations
Area
Population
(thousands)Increase
per cent per yearAnalysis of 1951-
1961 change per
cent per yearMigr-
ation
1951-
1961
(thous-
ands1931
1939
1951
1961
1931-
19391939-
19511951-
1961Births
Deaths
Migr-
ation(a)
(b)
(c)
(d)
(e)
(f)
(g)
(h)
(j)
(k)
(l)
(m)
England and Wales
39,952
41,444
43,758
46,072
0.45
0.46
0.51
1.59
1.15
0.08
352
Standard Regions and Conurbations:
Northern
3,038
3,003
3,141
3,252
-0.14
0.38
0.35
1.77
1.15
-0.27
-86
Tyneside Conurbation
827
825
836
852
-0.03
0.10
0.20
1.80
1.17
-0.43
-37
Remainder
2,211
2,178
2,305
2,399
-0.19
0.48
0.40
1.75
1.14
-0.21
-50
East and West Ridings
3,929
3,976
4,097
4,168
0.14
0.26
0.17
1.60
1.20
-0.24
-98
West Yorkshire Conurbation
1,656
1,658
1,693
1,703
0.02
0.18
0.06
1.56
1.31
-0.20
-33
Remainder
2,274
2,318
2,404
2,465
0.23
0.31
0.25
1.63
1.12
-0.26
-64
North Western
6,197
6,221
6,447
6,568
0.05
0.30
0.19
1.63
1.26
-0.19
-124
South East Lancashire Conurbation
2,427
2,414
2,423
2,427
-0.07
0.0.
0.02
1.61
1.28
-0.31
-76
Merseyside Conurbation
1,348
1,357
1,386
1,366
0.08
0.18
0.0
1.95
1.14
-0.81
-113
Remainder
2,421
2,451
2,638
2,756
0.15
0.63
0.43
1.49
1.30
0.24
66
North Midland
2,939
3,065
3,378
3,634
0.52
0.83
0.73
1.65
1.08
0.19
65
Midland
3,743
3,987
4,423
4,754
0.77
0.88
0.72
1.65
1.06
0.13
61
West Midlands Conurbation
1,933
2,079
2,237
2,344
0.89
0.63
0.46
1.65
1.05
-0.14
-31
Remainder
1,810
1,908
2,185
2,410
0.64
1.16
0.98
1.64
1.06
0.40
93
Eastern
2,433
2,691
3,098
3,736
1.24
1.20
1.88
1.63
1.09
1.34
455
London and South Eastern
10,330
11,046
10,906
11,093
0.82
-0.11
0.17
1.46
1.13
-0.17
-183
Greater London Conurbation
8,216
8,747
8,348
8,172
0.77
-0.40
-0.21
1.47
1.08
-0.60
-502
Remainder
2,114
2,300
2,558
2,921
1.04
0.91
1.33
1.44
1.28
1.17
319
Southern
1,956
2,133
2,441
2,819
1.07
1.15
1.44
1.64
1.10
0.90
237
South Western
2,794
2,857
3,229
3,408
0.27
1.04
0.54
1.52
1.22
0.24
78
Wales
2,593
2,465
2,599
2,641
-0.62
0.45
0.16
1.59
1.24
-0.19
-49
Wales I (South East)
1,898
1,782
1,856
1,895
-0.77
0.35
0.20
1.62
1.21
-0.20
-38
Wales II (Remainder)
696
683
742
746
-0.22
0.71
0.05
1.51
1.32
-0.14
-11
Table D
Population and changes
1911-1961
Totals of all urban
and all rural areas
1911
1921
1931
1939
1951
1961
Number of Areas*
Urban
1,109
1,126
1,120
965
965
993
Rural
657
663
638
479
477
474
Population
Urban
28,162,936
30,035,417
31,951,918
34,183,439
35,335,721
36,838,442
Rural
7,907,556
7,851,282
8,000,459
7,276,581
8,422,167
9,233,162
Percentage of total population
Urban
78.1
79.3
80.0
82.4
80.8
80.0
Rural
21.9
20.7
20.0
17.6
19.2
20.0
Urban population
Total increase in preceding period
Numbers
3,104,581
1,872,481
1,916,501
2,231,521
1,152,282
1,502,721
A.
Total growth index (ratio of population at and of intercensal period to that at beginning (equals 100) based on areas as differently constituted at the two census dates)
112.4
106.6
106.4
107.0
103.4
104.3
B.
Population growth index (ratio based on area as constituted at end of period)
111.1
105.2
104.9
103.8
103.4
104.1
C.
Area growth index (balance being ratio of population gained (lost) by boundary changes to the original population rated up by B.)
1.3
1.4
1.5
3.2
0.0
0.2
Rural population
Total increase or decrease (-) in preceding period
Numbers
438,068
-56,274
149,177
-723,898
1,145,606
810,995
A.
Total growth index (ratio of population at end of intercensal period to that at beginning equals 100) based on areas as differently constituted at the two census dates)
105.9
99.3
101.9
91.0
115.7
109.6
B.
Population growth index (ratio based on area as constituted at end of period)
110.2
104.3
107.8
103.7
115.9
110.5
C.
Area growth index (balance being ratio of population gained (lost) by boundary changes to the original population rated up by B.)
-4.3
-5.0
-5.9
-12.7
-0.2
-0.9
Table E
Population and intercensal
changes 1951 to 1961
Urban/rural
aggregates
Conurbations
Urban areas outside conurbations with populations of:—
Rural Districts
outside
conurbations100,000 or more
50,000 and less
than 100,000Less than 50,000
1951
1961
1951
1961
1951
1961
1951
1961
1951
1961
Number of Areas
230
229
31
34
48
65
687
667
474
472
Population
16,918,431
16,883,680
5,796,606
6,247,114
3,319,660
4,363,471
9,327,100
9,375,687
8,396,091
9,201,652
Percentage of total population
38.7
36.6
13.2
13.6
7.6
9.5
21.3
20.4
19.2
20.0
Total increase or decrease (-) in preceding period
-34,751
450,508
1,043,811
48,587
805,561
A.
Total growth index (ratio of population at end of intercensal period to that at beginning (equals 100) based on areas as differently constituted at the two census dates
99.8
107.8
131.4
100.5
109.6
B.
Population growth index (ratio based on area as constituted at the end of period)
99.8
102.6
114.8
108.9
110.4
C.
Area growth index (balance, being ratio of the population gained (lost) by boundary changes to the original population rated up by B.)
0.0
5.2
16.6
-8.4
-0.8
Table F
Distribution of urban areas
by rates of change, 1931 to 1939,
1939 to 1951 and 1951 to 1961
Rate of increase or decrease
Number of urban areas
1931-1939
1939-1951
1951-1961
Increase
per cent per year15 or more
2
-
4
10-
5
-
-
5-
30
4
16
4-
14
2
13
3-
36
9
30
2-
52
43
69
1-
114
257
177
Less than 1
288
479
359
Unchanged
-
-
3
Decrease
per cent per yearLess than 1
305
142
282
1-
101
13
37
2-
13
2
1
3-
-
5
2
4-
-
3
-
5 or more
-
1
-
Total
960*
960*
993*
Not determinable
33
33
-
Increases
Decreases
Kirkby U.D.
32.39
Salford C.B.
1.38
Harlow U.D.
24.89
East Ham C.B.
1.36
Crawley U.D.
17.73
Edmonton M.B.
1.23
Hemel Hempstead M.B.
8.91
Leyton M.B.
1.20
Havant and Waterloo U.D.
7.71
Tottenham M.B.
1.14
Basildon U.D.
7.36
Smethwick C.B.
1.10
Aldridge U.D.
5.72
Gateshead C.B.
1.08
Middleton M.B.
5.67
Walthamstow M.B.
1.06
Brentwood U.D.
5.66
Rhondda M.B.
1.04
Sutton Coldfield M.B.
4.23
Merton and Morden U.D.
0.94
Woking U.D.
3.54
Carshalton U.D.
0.87
Solihull M.B.
3.50
Southall M.B.
0.84
Thurrock U.D.
3.35
West Ham C.B.
0.83
Fareham U.D.
3.19
Portsmouth C.B.
0.81
Swindon M.B.
2.87
Brentford and Chiswick M.B.
0.79
Romford M.B.
2.66
Newcastle upon Tyne C.B.
0.79
Reigate M.B.
2.42
Wolverhampton C.B.
0.78
Orpington U.D.
2.39
Barking M.B.
0.78
Scunthorpe M.B.
2.16
Wigan C.B.
0.71
High Wycombe M.B.
2.13
Preston C.B.
0.69
Hornchurch U.D.
2.09
Warrington C.B.
0.66
Derby C.B.
0.65
Oldham C.B.
0.65
Manchester C.B.
0.61
Table G
Urban areas by size: Number, Population
and percentage change, 1961 and 1951
Population of urban areas
Number
of areasAggregate
population
1961Aggregate
population
of same
areas 1951Percentage
increase1,000,000
or more
2*
4,300,765
4,460,641
3.6
500,000
" " "
1,000,000
3
1,919,128
1,999,800
4.0
250,000
" " "
500,000
11
3,462,985
3,458,966
0.1
150,000
" " "
250,000
19
3,287,772
3,329,316
1.2
100,000
" " "
150,000
32
3,667,397
3,652,191
0.4
75,000
" " "
100,000
34
2,895,588
2,723,872
6.3
50,000
" " "
75,000
83
5,025,110
4,488,196
12.0
40,000
" " "
50,000
49
2,158,232
1,957,082
10.3
30,000
" " "
40,000
73
2,514,597
2,277,525
10.4
20,000
" " "
30,000
109
2,702,456
2,484,133
8.8
15,000
" " "
20,000
95
1,671,494
1,573,189
6.2
10,000
" " "
15,000
120
1,484,924
1,347,249
10.2
5,000
" " "
10,000
163
1,187,936
1,106,185
7.4
4,000
" " "
5,000
59
267,346
256,886
4.1
3,000
" " "
4,000
40
140,199
135,664
3.3
2,000
" " "
3,000
40
102,655
101,535
1.1
Less than 2,000
33
49,858
50,559
1.4
Total
965*
36,838,442
35,402,989
4.1
Table H
Population and intercensal
rates of change 1891-1961
Greater London, London
County and Outer Ring
1891
1901
1911
1921
1931
1939
1951
1961
Population:—
London County
4,227,954
4,536,267
4,521,685
4,484,523
4,397,003
4,013,400
3,347,982
3,195,114
Outer Ring
1,405,852
2,045,135
2,729,673
3,003,859
3,818,670
4,714,600
5,000,041
4,976,788
Greater London
5,633,806
6,581,402
7,251,358
7,488,382
8,215,673
8,728,003
8,348,023
8,171,902
Increase or decrease
(-) per cent per year
in preceding period:—
London County
-
0.71
-0.03
-0.08
-0.20
-1.11
-1.53
-0.46
Outer Ring
-
3.82
2.93
0.94
2.46
2.62
0.50
-0.05
Greater London
-
1.57
0.97
0.32
0.94
0.74
-0.38
-0.21
Corresponding
increase per cent per year in:—
England and Wales
-
1.16
1.04
0.48
0.54
0.37
0.54
0.51
All urban areas
-
1.84
1.17
0.63
0.63
0.83
0.28
0.42
Table J
Population and intercensal
change 1961 and 1951
New Towns
Population
Intercensal
increase1961
1951
Aycliffe
12,101
594
11,507
Basildon
53,707
24,661
29,046
Bracknell
20,380
5,143
15,237
Corby
35,880
16,743
19,137
Crawley
54,065
10,707
43,358
Cwmbran
30,043
13,656
16,387
Harlow
53,496
5,825
47,671
Hatfield
20,504
9,256
11,248
Hemel Hempstead
54,816
21,976
32,840
Peterlee
13,792
298
13,494
Stevenage
42,422
7,311
35,111
Welwyn
34,944
18,804
16,140
Total
426,150
134,974
291,176
Table K
Proportions of females
to males (per thousand)
Regions, Conurbations,
Urban/rural aggregates,
Counties with the
highest and lowest
proportions of females
1961
1951
1931
1961
1951
1931
England and Wales
1,066
1,082
1,088
Counties with highest
proportion of females:—
Standard Regions and
Conurbations:—
Sussex, East,
1,252
1,281
1,287
Sussex, West,
1,198
1,233
1,203
Caernarvonshire
1,161
1,169
1,130
Northern:
1,040
1,039
1,021
Wight, Isle of,
1,146
1,147
1,191
Tyneside Conurbation
1,068
1,088
1,047
Surrey
1,128
1,158
1,171
Remainder
1,031
1,022
1,012
East and West Ridings:
1,063
1,083
1,074
Devon
1,110
1,109
1,119
West Yorkshire Conurbation
1,093
1,133
1,150
Cornwall
1,107
1,096
1,136
Remainder
1,044
1,050
1,023
Westmorland
1,106
1,126
1,152
Somerset
1,103
1,127
1,161
North Western:
1,087
1,110
1,115
London
1,099
1,138
1,151
South East Lancashire
1,087
1,123
1,128
Merseyside Conurbation
1,092
1,122
1,119
Denbighshire
1,098
1,090
1,037
Remainder
1,085
1,091
1,100
Kent
1,091
1,104
1,087
Cheshire
1,091
1,098
1,118
North Midland
1,028
1,039
1,047
Middlesex
1,091
1,098
1,118
Midland
1,022
1,042
1,064
Lancashire
1,088
1,126
1,132
West Midlands Conurbation
1,027
1,071
1,080
Remainder
1,017
1,014
1,047
Counties with lowest
proportion of females:—
Eastern
1,039
1,051
1,069
London and South Eastern
1,109
1,138
1,142
Rutland
913
916
1,060
Greater London Conurbation
1,096
1,131
1,140
Huntingdonshire
944
927
1,023
Remainder
1,144
1,163
1,150
Breconshire
981
976
972
Suffolk, West
984
945
1,024
Southern
1,058
1,052
1,077
Cambridgeshire
993
1,052
1,020
South Western
1,074
1,069
1,111
Wales
1,046
1,046
1,004
Shropshire
993
938
1,025
Wales I
1,034
1,036
982
Wiltshire
994
903
1,004
Wales II
1,075
1,071
1,069
Peterborough, Soke of,
997
1,028
1,043
Bedfordshire
998
1,007
1,072
Lincolnshire (Parts of Kesteven
999
932
981
Urban/rural aggregates
Montgomeryshire
1,000
1,008
1,017
Conurbations
1,083
1,119
1,126
Monmouthshire
1,002
1,015
955
Areas outside conurbations
Oxfordshire
1,002
1,003
1,047
Urban areas with populations
Radnorshire
1,012
978
1,018
of 100,000 or more
1,068
1,095
Lincolnshire (Parts of Lindsey)
1,014
1,012
1,027
of 50,000 and less
than 100,0001,080
1,111
of less than 50,000
1,080
1,091
Rural districts
1,015
982
'Social Policies and Population Growth in Mauritius'
R.M. Titmuss and Brian Abel Smith. London. Methuen, 1961.