Statistical Notes
Previous Selection
PART II.—STATISTICAL NOTES
National Population.—
The total population in England and Wales as at midnight on Sunday, 8th April, 1951, according to preliminary summaries furnished by local Census Officers was 43,744,924 persons, 21,024,187 being males and 22,720,737 females.
In accordance with custom, the de facto
population thus recorded comprises all persons enumerated on land, in barges and boats on inland waters, in all vessels in ports or at anchorages at Census midnight other than ships of foreign navies, and also persons in boats on fishing or coast-wise voyages which returned to port during April not having proceeded from a port outside Great Britain, Ireland or their adjacent islands. The said population does not include members of the Armed Forces, Mercantile Marine or other civilians outside the country and in this respect omits a number of persons who might otherwise be regarded as part of the national population, the defect being probably somewhat greater on this occasion than it was at the preceding Census of 1931. Lack of comparability on this account, however, will have been slightly offset by the inclusion in the 1951 enumerated population of certain units of the Armed Forces of the U.S.A. which had no counterpart in 1931.
Altogether, the marginal items may be regarded as of little substance in relation to the enumerated total of 43,745 thousands which now stands as the largest ever to have been reached in this country. As a single figure its main significance probably lies in the average density which it represents, viz., 7501
persons per square mile, a density which, with a possible exception in the case of the Netherlands, is far higher than that of nearly every other country of the world and is several times as high as that of most of them. This outstandingly high concentration of people on the ground is a feature which must be ever present in mind in the consideration of all problems in which the magnitude of the population plays any part.
The 1951 total exceeds the number returned at the previous enumeration of 26th April, 1931, by 3,793 thousands, representing a rate of increase of 9.49 per cent, over the 20 intervening years. The intercensal interval on this occasion, however, is double that of all preceding intervals in the census series, and to obtain a more satisfactory comparison with the past it is necessary to convert the increase now recorded to its decennial equivalent. In this form the decennial rate of increase is one of 4.65 per cent., a figure which compares with 4.93 for the 1911-21 decennium covering the first world war and the rather higher 5.53 per cent, increase during the inter-war decennium of 1921-31, all three standing in strong contrast with increases twice or more as great which were characteristic of all periods prior to 1911 right back to the date of the earliest Census taken in 1801.
Even so, the picture is not quite complete. The past 20-year period has not been one of normal progressive continuity. Former peace-time trends were no doubt more or less maintained up to the outbreak of war in 1939; but after that the position must have been increasingly, if not wholly, dominated by the impact of war conditions and any review, to be complete, should take account of the separate pre- and post-1939 sections as well as of the combined whole. The published estimate of the home population as at mid-1939, viz., 41,460,000, has not quite the authority of a census count but it was arrived at after full consideration of the National Register count of civilians made later in that year and will be broadly representative of the immediate pre-war position. It indicates that the population increased by about 1½ millions in the 8¼ years between the 1931 Census and the middle of 1939, and by rather more than 2¼ millions in the subsequent 11¾ years to date, the successive increments being equivalent to decennial rates of increase of 4.63 and 4.66 per cent. in the respective sections. Division in this way indicates that, though the rate of growth in the pre-war period was slightly below that of the preceding intercensal period, 1921-31, the fall was not a progressive one; the increase has been more than maintained up to the present time and so far shows little sign of abating.
| DIAGRAMS A:
|
150 YEARS POPULATION GROWTH 1801-1851
|
ENGLAND AND WALES
|
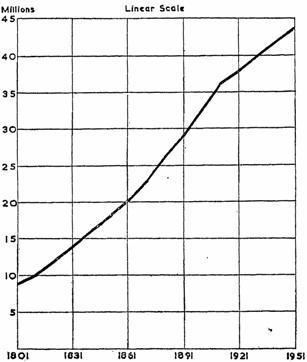
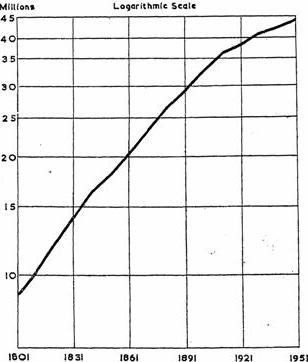
For those to whom the perspective of events is more readily conveyed in pictorial form, Diagrams A are included showing the growth of the population over the past 150 years, 1801 to 1951, based on the numerical census facts set out in Table I of this volume, supplemented by the above-mentioned estimate for the year 1939.
The population development is here shown in two ways; by a linear representation on the left in which the successive intercensal rises in the curve are proportionate to the amount of the intercensal increase and by the slightly different logarithmic representation on the right in which the slope of the curve reflects the rate of increase rather than its amount. The latter more effectively displays the general lowering of the rate of growth which set in after about 1911.
The important features of the series representation, however, which cannot be too strongly stressed at the present time,' having regard to the frequency of statements concerning the onset of stationary or declining conditions, are that the population continues to grow, that there has been little change in its successive rates of increase for the past 40 years, and that so far there is no sign of any tapering away of the successive increments such as would normally be expected to herald the early approach of an ultimate population maximum.
Intercensal Population Estimates.—
The 1951 Census count constitutes a new bench-mark in the record of the national population development and, in so doing, serves as an opportunity for reviewing the periodical estimates of population which it is customary to prepare and use in the absence of a factual count during the years of the intercensal period.
An estimate as at the date of the present Census, constructed according to the method employed by the General Register Office, put the expected census total at about 43,821 thousands, which is higher than the enumerated total by 76 thousands, representing an overestimate of less than 2 per 1,000 population. A difference of this order is not large and serves generally to confirm the adequacy of the present estimate construction for the bulk of the practical purposes which the estimates are intended to serve. Had the intercensal period been a normal one, the end test would have sufficed to confer a like degree of confirmation on the whole of the similarly constructed estimates of the intermediate years. That does not, however, apply in the present case owing to the interruption of normal conditions in 1939 by the outbreak of the second world war. From 1932 to 1939 the successive estimates were of the home population, obtained by continued projection from the census record of 1931, and these were more or less confirmed by the National Register count of civilians made in 1939 as indicated above. But with the onset of war conditions both the nature of the population identified and the records available for its identification were subject to changes for a full description of which reference should be made to the 1940-45 Civil Text of the Registrar General's Statistical Review. It is sufficient to observe that from 1939 the normal estimates of the home population were extended to include this country's Forces and Mercantile Marine serving overseas, excluding at the same time the Forces of the Dominions, Colonies and foreign countries which were temporarily transferred to this country. Estimates of the extended population have been maintained to date, but from 1949 estimates have also been provided of the some population, thus restoring the normal peacetime procedure and linking the estimates once again with the type of population enumerated at the Census.
DIAGRAM B: CENSUS POPULATIONS AND INTERCENSAL ESTIMATES
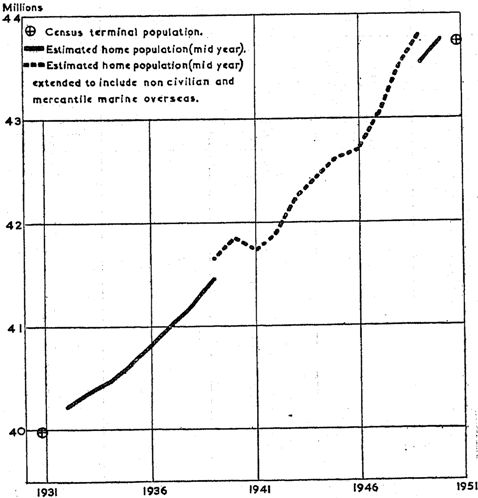
The successive intercensal estimates as published at the time are shown in pictorial form in Diagram B between the two authenticated terminal points represented by the 1931 and 1951 Census populations. Set out in this way, the progression discloses some irregularity in the series of war time estimates, particularly those of the early years of the war when, for security and other reasons, the ascertainment of the relevant facts was attended by unusual difficulty and delay. Looked at in retrospect, however, the weakness thus indicated appears to have been little more than superficial, for the portrayal of the broad progressive trend of upward movement seems to have been adequately achieved; so that the new census total, like that of 1931 before it, can be regarded as having performed its indispensable function of supplying a check upon the continuous record, without disclosing any outstanding need for its retrospective revision.
Intercensal Movement
. The provisional net intercensal increase of 3,793 thousands may be resolved into its more important elements as follows:—
| Increase:—
|
(thousands)
|
| Live Births in England and Wales |
(+) |
13,297 |
| Decreases:—
|
|
| Deaths registered in England and Wales— |
|
| Total (excluding non-civilians after 3rd September, 1939) |
(-) |
9,943 |
| Non-civilian (after 3rd September, 1939) |
(-) |
66 |
Deaths of non-civilians and merchant seamen belonging to
England and Wales which occurred outside England and Wales
after 3rd September, 1939 (estimated) |
(-) |
240 |
| Increase:—
|
(thousands)
|
Balance representing a net gain from the miscellaneous movements
summed up in the term "migration" |
(+) |
745 |
| Net intercensal increase |
(+) |
3,793 |
(See Notes to Tables A and B)
TABLE A shows these movements in comparison with those of preceding intercensal periods since 1871.
Table A
(figures in thousands)
| Intercensal Period. |
Intercensal
Increase in
Population. |
Live Births
in England
and Wales. |
Deaths in
England
and Wales. |
Excess of
Live Births
over Deaths
in England
and Wales. |
Balance
representing
net gain or
loss (-) by
migration of
all types. |
|---|
| 1871-1881 |
3,262 |
8,604 |
5,178 |
3,426 |
-164 |
| 1881-1891 |
3,028 |
8,894 |
5,265 |
3,629 |
-601 |
| 1891-1901 |
3,525 |
9,157 |
5,563 |
3,594 |
-69 |
| 1901-1911 |
3,543 |
9,290 |
5,246 |
4,044 |
-501 |
| 1911-1921 |
1,816 |
8,281 |
5,268 |
3,013 |
-1,197*
|
| 1921-1931 |
2,066 |
6,928 |
4,692 |
2,236 |
-170 |
| 1931-1951 (20 years) |
3,793 |
13,297 |
10,009 |
3,288 |
505*
|
*
Including losses of 577 and 240 thousands of non-civilians and merchant seamen belonging to England and Wales who died outside the country during 1914-18 and from 1939 respectively (see also Table B).
In Table B, the movements of more recent periods are shown for individual years or by annual averages so that the more important changes in amount and direction may be more precisely located.
TABLE B
(figures in thousands)
Year
(July to June). |
Live Births
in England
and Wales.
* |
Deaths registered
in England and Wales. |
Excess of
Live Births
over Deaths
in England
and Wales. |
Deaths of
Non-Civilians
and
Merchant
Seaman
belonging to
but dying
outside
England
and Wales
(approximate)
‡ |
Estimated
net gain
or loss
due to
civilian
migration.
§ |
|---|
| Total. |
Non-
Civilians
included
in Total.
† |
|---|
Yearly
Aver-
ages |
{
|
1921-26 (5 years) |
750 |
469 |
|
281 |
|
-45 |
| 1926-31 (5 " ) |
654 |
484 |
|
170 |
|
5 |
| |
|
|
|
|
|
|
| 1931-39 (8 " ) |
607 |
489 |
|
118 |
|
66 |
| 1939-45 (6 " ) |
650 |
514 |
9 |
136 |
(see below) |
48 |
| 1945-50 (5 " ) |
781 |
496 |
2 |
285 |
|
-12 |
| |
|
|
|
|
|
|
| 1931-32 |
626 |
484 |
|
142 |
|
71 |
| 1932-33 |
599 |
493 |
|
106 |
|
43 |
| 1933-34 |
584 |
483 |
|
101 |
|
16 |
| 1934-35 |
594 |
466 |
|
128 |
|
50 |
| 1935-36 |
602 |
496 |
|
106 |
|
88 |
| |
|
|
|
|
|
|
| 1936-37 |
609 |
505 |
|
104 |
|
88 |
| 1937-38 |
621 |
484 |
|
137 |
|
47 |
| 1938-39 |
618 |
497 |
|
121 |
|
124 |
| 1939-40 |
605 |
550 |
4 |
55 |
}
240 |
173 |
| 1940-41 |
569 |
575 |
12 |
-6 |
-83 |
| |
|
|
|
|
|
| 1941-42 |
618 |
485 |
9 |
133 |
94 |
| 1942-43 |
678 |
462 |
10 |
216 |
85 |
| 1943-44 |
718 |
513 |
11 |
205 |
20 |
| 1944-45 |
713 |
499 |
10 |
214 |
0 |
| 1945-46 |
717 |
489 |
4 |
228 |
-40 |
| |
|
|
|
|
|
| 1946-47 |
911 |
523 |
2 |
388 |
-37 |
| 1947-48 |
811 |
461 |
2 |
350 |
28 |
| 1948-49 |
751 |
508 |
1 |
243 |
-28 |
| 1949-50 |
713 |
501 |
1 |
212 |
19 |
*
Actual birth occurrences 1939 to 1949 inclusive; numbers registered in other periods.
†
Not available for periods prior to 3rd September, 1939. The figures exclude deaths of non-civilians of Dominions, Colonies or Foreign Countries which occurred in England and Wales.
‡
Estimate based on figures for the United Kingdom supplied by the War Departments, including the "Missing, Presumed Dead The proportion assigned to England and Wales (about 89 per cent.) was based upon the numbers originally recruited from the several parts of the United Kingdom.
§
Total migration for years prior to 1931.
Looking at the intercensal period as a whole and remembering that it covers 20 years, the comparative summary of Table A indicates that the numbers of births have been relatively fewer and the numbers of deaths relatively more numerous than they were in the preceding period 1921-31, the combined effect of the two being apparently to mark a further step in the decline—dating from the beginning of the century—in the intercensal records of natural increase. On the other hand the remaining elements of movement summed up under the term migration show a substantial gain on balance, which may be regarded as of more than ordinary significance since it is the first of its kind to have been registered in this series in the whole of the past century, the corresponding records for previous census intervals, though varying in size, having invariably been outward on balance and an offset therefore to the gain by natural increase.
The overall picture obtained in this way is, however, an over-simplified one which suppresses much of the more significant features of the changes which are to be associated with recent years. For these, reference must be made to the fuller analysis of Table B in which the record is set out by individual years and summarized in the form of annual averages within the three phases covering respectively the pre-war, war and post-war periods.
From this more detailed statement, the feature to which will probably be assigned the greatest importance is the change of direction in the trend of births since the early years of the war. After having fallen more or less continuously for nearly 60 years the birth rate levelled itself out in the years immediately preceding the war and has since been subject to an increase as steep almost as the last stages of the fall. It is true of course that a number of the births following the cessation of the war will be regarded in the nature of postponements from the war period itself and theoretically transferable thereto in any satisfactory appreciation of the situation, but there can be no gainsaying the substantial recovery which has taken place and which has now been maintained for virtually a decade.
The basic importance of the recent increase in births is probably to be found in its arrest of the decline in the population's reproductive capacity which was a feature of the inter-war years and which was the fundamental justification for the public apprehension that arose in those years about the future of the population. The said total reproductive capacity is higher today than it was in 1940 and, in so far as its maintenance is to be regarded as a primary condition of population stabilization, the population may be said to have stabilized itself for the past 10 years, a condition which is being substantially maintained at the present time and will continue to be maintained so long as the latent reproductive capacity periodically added by the new births is sufficient to replace the reproductive capacity consumed in the course of producing them.2
Of the deaths assigned to the intercensal period, amounting in all to 10¼ millions, the only unusual feature of note has been the lamentable loss of some 360 thousand persons which represents the country's share of the human sacrifice imposed upon it by its participation in the second world war. Of the exceptional war deaths about 300 thousands are assigned to the Armed Forces and Mercantile Marine and, though not large in relation to the total deaths of the period, their concentration among the younger adult male section of the population will have left a scar that will be visible for many years to come; the remaining 60 thousands which resulted from the enemy's undiscriminating attack on the civilian population covered all classes and was therefore of not the same sex-age significance.
Apart from the special war loss, the incidence of the deaths has been remarkably constant over the 20 years; the average annual numbers during the pre-war, war, and post-war sections of the period have been almost stationary at 489, 495 and 494 thousands respectively. When regard is had, however, to the considerable ageing of the population that has taken place over the 20 years and also to the increase in its total size, the levelling out of the numbers of deaths is itself a notable, if unspectacular, tribute to the continuing progress made in the combating of mortality. This, as judged by the Comparative Mortality Index used in the Statistical Reviews, shows a steady fall throughout the period amounting in all to nearly 30 per cent, over the 20 years, an achievement which would have been remarkable under normal conditions and is even more so at the present time in the light of the special strains, privations and other adverse conditions of the war and post-war years.
The war deaths which occurred outside the country (estimated at 240 thousands) have been technically treated as emigrants for the purpose of Table A and included as such in the last column of that table. When allowance is made for them, the figure of 505 thousands there shown is raised to 745 thousands and this may thus be regarded as approximately representing the net gain that has accrued to the population from all sources other than the natural forces of birth and death.
This gain is noteworthy, as stated above, because this is the first intercensal period in the past century to have registered a net increase of population by migration and is thus in direct contrast with earlier experiences. It has to be remembered however that in its net form it is merely the difference between two much larger movements in opposing directions and that changes in either of the direct movements may have a quite disproportionate effect on the series of differences.
The so-called migration element has been influenced on this occasion by a number of factors that would not ordinarily be present in a more normal period. Part of the recorded gain, for example, has been due to the discharge into the civilian population of about 80 thousands of Polish and other Allied Armed Forces who elected to remain here after the war rather than return to their original home lands while a further temporary increment has accrued from the recent transfer to this country of Armed Forces of the U.S.A.; against these somewhat fortuitous gains, however, is to be set the slightly greater loss to the home population by the increase in the number of its own Armed Forces serving or stationed overseas. When allowance is made for these special elements, a round figure of three-quarters of a million is left which may be regarded as broadly representing the net gain from the individual type of civilian movement which is commonly implied in any general use of the term migration.
The said civilian migration has been apportioned, as well as the circumstances permit, over the several years of the intercensal period in the last column of Table B and, though not in any way precise, it is probably sufficiently valid to indicate that about two-thirds or more of the total occurred prior to the war with an average gain of about 66 thousands per annum over the years 1931 to 1939, that it diminished during the six war years with an annual average gain of about 48 thousands, after which it was converted to a loss on balance during the immediate period of post-war resettlement and has since been followed by less significant and less consistent changes in more recent years.
The migration so described comprises movements to and from other parts of the United Kingdom as well as countries outside the United Kingdom and, though it has long been known that the former were usually inward on balance, it was not possible separately to identify them prior to 1939. From the setting up of the National Register in 1939, however, records have been obtained indicating that the net gain to England and Wales from other parts of the United Kingdom averaged 14 thousands a year during the six war years, 66 thousands a year between mid-1945 and mid-1947 and about 16 thousands a year thereafter to the present time.
Population and Variations in Geographical Sections of the Country.
Table C shows approximately how the variations in the population, which for the whole of England and Wales in the 20 years 1931-51 amounted to a net increase of 9.5 per cent., were distributed over the main geographical sections of the country.
The standard regions now employed for the purpose were determined by a Cabinet Committee in 1946 after consultation with Government Departments concerned with regional organization; the standardization was designed to promote the general co-ordination of their several functions and it was a natural if not inevitable corollary that the population records and derived statistics on which much of the regional administrative work depends should be fitted to the framework adopted. The main difference between the present divisions and those adopted for the 1931 Census and subsequent vital statistical records consists in the fact that England is now covered by 10 sections as against the former n and that Wales is now a single region instead of being divided. Further, while the former divisions were all aggregations of integral counties, the counties of Derby, Essex and Hertford are now each split between 2 adjacent regions. The constitution of the new regions is indicated in the first column of Table C and set out in full in Appendix B.
TABLE C
| Area |
Population
(in thousands). |
Intercensal
Increase
(- = Decrease) |
Analysis of 1931-51 Increase. |
|---|
| 1921 |
1931 |
1951 |
1921-
31
Per
cent. |
1931-
51
Per
cent. |
Births
Per
cent of
1931 |
Deaths
Per
cent of
1931 |
Gain or Loss (-) by Migration. |
|---|
Per
cent. of
1931 |
Amount (in thousands.) |
|---|
1931-
51 |
1931-
39 |
1939-
51 |
|---|
| (a)
|
(b)
|
(c)
|
(d)
|
(e)
|
(f)
|
(g)
|
(h)
|
(j)
|
(k)
|
(l)
|
(m)
|
|---|
| England and Wales
|
37,887
|
39,952
|
43,745
|
5.5
|
9.5
|
33.3
|
25.1
|
1.3
|
505
|
525
|
-20
|
Standard Regions:
|
|
|
|
|
|
|
|
|
|
|
|
Northern
Cumberland
Durham
Northumberland
Westmorland
Yorkshire, North
Riding
|
3,013 |
3,038 |
3,140 |
0.8 |
3.3 |
35.2 |
24.9 |
-6.9 |
-209 |
-149 |
-60 |
East and West
Ridings
Yorkshire, East
Riding
Yorkshire, West
Riding
|
3,765 |
3,929 |
4,096 |
4.4 |
4.2 |
32.9 |
25.3 |
-3.4 |
-132 |
-41 |
-90 |
North Western
Cheshire
Derbyshire (part
of)
Lancashire
|
6,071 |
6,197 |
6,445 |
2.1 |
4.0 |
32.5 |
26.5 |
-2.1 |
-128 |
-59 |
-70 |
North Midland
Derbyshire (part
of)
Leicestershire
Lincolnshire
Northamptonshire
Nottinghamshire
Peterborough,
Soke of Rutlandshire
|
2,763 |
2,939 |
3,378 |
6.4 |
15.0 |
35.7 |
24.5 |
3.8 |
111 |
32 |
78 |
Midland
Herefordshire
Shropshire
Staffordshire
Warwickshire
Worcestershire
|
3,546 |
3,743 |
4,422 |
5.6 |
18.1 |
37.8 |
24.7 |
5.0 |
188 |
100 |
88 |
Eastern
Bedfordshire
Canbridgeshire
Ely, Isle of
Essex (part of)
Hertfordshire
(part of)
Huntingdonshre
Norfolk
Suffolk, East
Suffolk, West
|
2,183 |
2,433 |
3,096 |
11.5 |
27.2 |
35.4 |
26.3 |
18.1 |
441 |
201 |
240 |
London and South
Eastern
Essex (part of)
Hertfordshire
(part of)
Kent
London (Admin.
County)
Middlesex
Surrey
Sussex, East
Sussex, West
|
9,457 |
10,330 |
10,902 |
9.2 |
5.5 |
30.5 |
23.2 |
-1.8 |
-183 |
458 |
-640 |
Southern
Berkshire
Buckinghamshire
Dorsetshire
Oxfordshire
Southampton
Wight, Isle of
|
1,919 |
2,135 |
2,648 |
11.3 |
24.1 |
35.2 |
26.2 |
15.0 |
320 |
129 |
191 |
South Western
Cornwall
Devonshire
Gloucestershire
Somersetshire
Wiltshire
|
2,512 |
2,615 |
3,021 |
4.1 |
15.5 |
32.7 |
27.5 |
10.4 |
272 |
36 |
236 |
Wales (including
Monmouthshire) |
2,658 |
2,593 |
2,597 |
-2.4 |
0.1 |
32.2 |
25.3 |
-6.7 |
-175 |
-182 |
7 |
In each of the regions, the population of 1951 is greater than it was in 1931 with increases varying between 27.2 and 0.1 per cent.—a fairly wide range for areas of these dimensions, In half the regions the increases exceed the average for the country as a whole and are below in the other half, but with a contrast greater than would be normally expected from this equal division; in the above-average areas the increases are not only above but substantially above average, none being less than 15 per cent, and reaching 24.1 and 27.2 in the Southern and Eastern areas; in the below-average increases on the other hand, the highest is of 5.5 per cent, in the London and South Eastern diminishing to the barely perceptible minimum of 0.1 per cent, for Wales.
Compared with the preceding period 1921-31, the changes in a majority of the regions call for no outstanding comment having regard to the comparable national increases recorded. The main and outstanding exception to this generality is the London and South Eastern region with a recent rate of increase little more than half the national figure in contrast to one nearly double in the earlier period; the explanation and location of the change is at once evident from the last two columns of the table from which it is clear that the steady and substantial gain by migration which was a feature of earlier years continued unabated up to the outbreak of war following which it was reversed by an unsurpassed loss, mainly by evacuation, from which it has not recovered and of which the net result has been more than to offset the immigrant gain of the pre-war section of the period. The somewhat abnormal advance now recorded for the South Western region is probably largely to be explained as part of the complementary gain arising from the loss in London and South Eastern, In spite of such recovery as has been made from the earlier depression in the coal mining, heavy manufacturing and textile industries of the north, the regions involved still continue to lose population by migration on balance, a condition which probably characterizes Wales also though there may have been an offsetting gain here from the retention of some of the war evacuees. The above-average rates of growth recorded for the Southern, Eastern and the two Midland regions between 1921 and 1931 are even more accentuated in the latest record, a reflection no doubt of the general prosperity associated with them.
Counties.—
Turning now to the counties, Table V on page 44 shows how the intercensal increases and decreases are distributed amongst the several counties, the area for this purpose being the administrative county with its associated county boroughs.
They are summarized in Table D and shown side by side with the distribution for the preceding intercensal period.
TABLE D
| Rate of Increase or Decrease |
1921-1931 |
1931-1951 |
|---|
Number
of
Counties. |
Increase or
Decrease in
Population. |
Number
of
Counties. |
Increase or
Decrease in
Population. |
|---|
Percentage
Increase |
{
|
50-55 |
— |
— |
1 |
208,529 |
| 45-50 |
— |
— |
— |
— |
| 40-45 |
— |
— |
3 |
301,726 |
| 35-40 |
— |
— |
2 |
1,050,725 |
| 30-35 |
1 |
385,726 |
1 |
65,981 |
| 25-30 |
1 |
250,792 |
4 |
551,904 |
| 20-25 |
1 |
68,011 |
5 |
507,396 |
| 15-20 |
— |
— |
12 |
1,234,649 |
| 10-15 |
6 |
364,985 |
9 |
491,823 |
| 5-10 |
13 |
577,440 |
9 |
276,115 |
| 0-5 |
22 |
604,253 |
6 |
225,284 |
| |
|
|
|
|
|
Percentage
Decrease |
{
|
0-5 |
9 |
149,373 |
7 |
69,109 |
| 10-15 |
9 |
36,156 |
2 |
3,809 |
| 5-10 |
— |
— |
— |
— |
| 15-20 |
— |
— |
— |
— |
| 20-25 |
— |
— |
1 |
1,048,667 |
| 25-30 |
— |
— |
— |
— |
| |
|
|
|
|
|
| |
Total |
{
|
44 |
+2,251,207 |
52 |
- 4,914,132 |
| 18 |
-185,529 |
10 |
-1,121,585 |
In 52 of the 62 county areas thus identified, the population has increased since 1931 and in 37 of the 52 the rate of growth exceeds the average for the country as a whole. Hertfordshire ranks highest on the list with an increase of 52.0 per cent, placing it well away from the three next ranking counties of Sussex West, Buckingham and Bedford each with substantial increases of between 41 and 43 per cent. Nine of the ten counties with the highest advances are located around London or in the south eastern corner of the country and, though the larger part of their increases in most cases had accrued in the years prior to the war, the development since 1939 has in every case been above the national average and, in most, substantially so.
The outstanding feature of the county record, however, is that of the County of London which is dealt with in greater detail later and may be noted here as having lost more than a million of its population since 1931. Its percentage decline of 23.8 is nearly four times as great as the next lower decline in the county series and with the exception of Durham (-1.5 per cent.) it is the only English county with a 1951 population lower than that of 1931. The other eight of the ten counties in which decreases are recorded are from Wales (including Monmouthshire), the downward movement in their case generally continuing a trend which was in evidence prior to 1931. The remaining counties of Wales all register growths below the national average except Flint in respect of which the comparatively high increase of 28.5 per cent, is recorded.
The small counties of Rutland, West Suffolk and Hereford are noteworthy in registering increases well above the national average in succession to losses in the preceding intercensal period; a similar tendency being observable also in the agricultural counties of Buckingham, Wilts, Huntingdon and Lincoln (Kesteven) with present increases more than two or three times the national average following extremely modest under-average increments in 1921-31.
The range of percentage gains and losses shown by Table D is considerably wider for the 1931-51 period, not unnaturally so since it covers a period of 20 years as compared with 10 in the preceding intercensal period, but on the whole the development may be regarded as having been more generally spread since 1931, 37 of the counties now registering increases above the national average as compared with 23 only between 1921 and 1931.
Urban and Rural Areas.—
Under the operation of the Local Government Act of 1929, the areas of all non-county boroughs, urban districts and rural districts were subjected to a comprehensive review, as a result of which a large number of them have been the subject of considerable rearrangement and modification since the date of the last Census. The major changes resulting therefrom were substantial reductions in the numbers of the areas themselves, boroughs and urban districts being reduced from 1,148 to 992 and rural districts from 645 to 478, and the transfer, in pursuance of that Act and of certain Local Acts, of nearly a million persons on balance from the rural to the urban category thereby reducing the proportion of population in rural districts from 20.0 per cent. of the total population as at the 1931 Census to 17.6 per cent, after completion of the changes.
Reference to Table G on page xxi shows that there are now 965 urban areas in the country (including county and municipal boroughs and counting the Administrative County of London as one district) and that their populations amounted in all to 35,322,104 persons at the date of the 1951 Census, while the population of the 479 rural districts amounted to 8,422,820, the several proportions now living in urban and rural districts being 80.7 and 19.3 per cent, respectively.
These figures are shown in relation to the similarly arranged statistics of earlier Censuses in the following table.
TABLE E
|
1901 |
1911 |
1921 |
1931 |
1939*
|
1951 |
| Number of Areas†
|
{
|
Urban |
1,094 |
1,109 |
1,126 |
1,120 |
965 |
965 |
| Rural |
664 |
657 |
663 |
638 |
479 |
479 |
| Population |
{
|
Urban |
25,058,355 |
28,162,936 |
30,035,417 |
31,951,918 |
34,183,439 |
35,322,104 |
| Rural |
7,469,488 |
7,907,556 |
7,851,282 |
8,000,459 |
7,276,561 |
8,422,820 |
Percentage of Total
Population |
{
|
Urban |
77.0 |
78.1 |
79.3 |
80.0 |
82.4 |
80.7 |
| Rural |
23.0 |
21.9 |
20.7 |
20.0 |
17.6 |
19.3 |
| |
|
|
|
|
|
|
| Urban Population
|
Per cent. |
Per cent. |
Per cent. |
Per cent. |
Per cent. |
Per cent. |
Total increase in preceding
period |
+ |
19.9 |
+ |
12.4 |
+ |
6.6 |
+ |
6.4 |
+ |
7.0 |
+ |
3.3 |
| ‡
Self growth |
+ |
15.2 |
+ |
11.1 |
+ |
5.2 |
+ |
4.9 |
+ |
3.8 |
+ |
3.3 |
Balance (representing transfer
from Rural Districts) |
+ |
4.7 |
+ |
1.3 |
+ |
1.4 |
+ |
1.5 |
+ |
3.2 |
— |
| |
|
|
|
|
|
|
| Rural Population
|
|
|
|
|
|
|
Total increase in preceding
period |
— |
7.9 |
+ |
5.9 |
— |
0.7 |
+ |
1.9 |
— |
9.0 |
+ |
15.8 |
| ‡
Self growth |
+ |
2.9 |
+ |
10.2 |
+ |
4.3 |
+ |
7.8 |
+ |
3.7 |
+ |
15.8 |
Balance (representing transfer
to urban areas) |
— |
10.8 |
— |
4.3 |
— |
5.0 |
— |
5.9 |
— |
12.7 |
— |
*
See reference in text to the review and revision of boundaries under the Local Government Act of 1929. The figures for 1939 are based on estimates.
†
For the purposes of this table the County of London is reckoned as one urban area.
‡
Self growth as here shown is the rate of population increase within the actual boundaries subsisting at the end of the relevant period.
From what has already been said it will be observed that, in terms of the areas as now constituted, the proportion of the total population in the urban section has declined from 82.4 per cent, to 80.7 per cent, since 1931 and that in the rural section the complementary increase has raised the proportion from 17.6 per cent, to 19.3 per cent. The last two columns of Table E show that this change in favour of the rural section is wholly located in the years since 1939, the rates of self growth within the two sections between 1931 and 1939 being practically the same leaving the recorded proportions of 1939 unchanged from those of 1931. The latest 1939-51 experience is noteworthy in that it is the first occasion for more than a century on which the rural section has gained at the expense of the urban community. During the nineteenth century when the labour demands of newly developed industries drew masses of people from the countryside to the towns, the urban element continuously and rapidly outgrew the rural section, but after 1901 the general character of the advance changed, the later increases in urbanization being relatively much smaller and much more due to the natural growth between 1931 and 1939 and the later development now in favour of the rural section may be the beginning of a reversal of the long-dated earlier trend though its precise significance must await a fuller examination of the contributory factors than is possible here. The need to grow more food has undoubtedly extended demands on agriculture but to what extent these have been satisfied by migration of machines rather than men needs to be established. Again the more generous scale of housing now demanded by the population, coupled with the earmarking of "green belts", will have stimulated developments outside the more congested areas of the towns themselves. These may well develop further as time goes on. On the other hand it is not unlikely that they are exaggerated in the recent changes as now recorded since these will have been unnaturally stimulated by the war destruction in the centres of many of our towns and the resulting outward pressures on their inhabitants pushing many of them into rural fringes outside the town boundaries; the virtual suspension of boundary adjustments since 1939 will have prevented such growths from being brought within the sphere of urban administration. Examples also exist of persons, originally evacuated from town to country to avoid air raid risks during the war, permanently settling in their new area either from choice or compulsion— another "once for all" type of change that would need to be discounted in any attempt to evaluate the more permanent element in the national trend.
Table F classifies the urban areas according to their variations in a similar manner to that adopted for counties in Table D.
TABLE F
| Rate of Increase or Decrease |
1921-1931 |
1931-1951 |
|---|
No. of
Urban Areas |
No. of
Urban Areas |
|---|
Percentage
Increase |
{
|
150 and over |
5 |
13 |
| 100-150 |
9 |
11 |
| 50-100 |
23 |
59 |
| 40-50 |
11 |
42 |
| 30-40 |
26 |
72 |
| 20-30 |
59 |
111 |
| 10-20 |
121 |
213 |
| 0-10 |
428 |
226 |
| |
|
|
Percentage
Decrease |
{
|
0-10 |
371 |
160 |
| 10-20 |
75 |
62 |
| 20-30 |
14 |
13 |
| 30-40 |
5 |
2 |
| 40-50 |
1 |
5 |
| 50 and over |
— |
4 |
| |
|
|
| |
Total |
*
1,148 |
*
993 |
*
The 28 Metropolitan Boroughs and the City of London are here treated as separate districts.
The sub-division of the urban population into a large number of separate units discloses, as might be expected, a wide range of increase and decrease variations. The range, moreover, will necessarily tend to be wider for an intercensal interval covering 20 years such as that which has elapsed since 1931 than it was for the immediately preceding interval of 10 years. For that reason alone the behaviour of the local populations in the two intervals will not be readily comparable quite apart from the great disparity of conditions in the two periods resulting from the inclusion in the more recent period of all the mass movements of population associated with the war on a scale never before experienced in this country. During the period 1931-51, 24 towns have more than doubled their populations as against 14 between 1921 and 1931. Of these, two record phenomenal increases in excess of 900 per cent., viz., Huyton with Roby U.D (973 per cent.) adjoining Liverpool and Corby U.D. (946.6 per cent.) in Northamptonshire, with Ruislip-Northwood in Middlesex third at 325.8 per cent., and 10 others in excess of 200 per cent On the other hand the number of the decreases now recorded are far fewer at 246 than the 466 similar cases in 1931, though the range of decrease has been extended through the quite abnormal reductions registered in the London boroughs.
From Table G, in which the urban areas are graded according to their populations in 1951, it will be seen that more than half the total population and nearly two-thirds of the urban population are aggregated in comparatively dense units containing more than 50,000 each. On the other hand 50 per cent, of the towns (at the lower end of the scale) contain less than 8 per cent, of the total or 10 per cent, of the urban population.
TABLE G
| Population of urban areas |
No.
of
areas |
Aggregate
population,
1951 |
Aggregate
population
of same
areas, 1939 |
Aggregate
population
of same
areas, 1931 |
Mean percentage
Increase or Decrease |
|---|
| 1931-39 |
1939-51 |
|---|
| Over 1,000,000 |
2*
|
4,460,676 |
5,066,300 |
5,399,606 |
— |
6.2 |
— |
12 |
| 500,000 |
and under |
1,000,000 |
4 |
2,510,495 |
2,569,000 |
2,623,467 |
— |
2.1 |
— |
2.3 |
| 250,000 |
" " |
500,000 |
8 |
2,449,841 |
2,350,100 |
2,291,216 |
+ |
2.6 |
+ |
4.2 |
| 150,000 |
" " |
250,000 |
17 |
3,209,591 |
3,221,700 |
3,043,374 |
+ |
5.9 |
— |
0.4 |
| 100,000 |
" " |
150,000 |
35 |
4,181,858 |
4,036,760 |
3,868,174 |
+ |
4.4 |
+ |
3.6 |
| 75,000 |
" " |
100,000 |
25 |
2,121,043 |
1,970,010 |
1,783,725 |
+ |
10.4 |
+ |
7.7 |
| 50,000 |
" " |
75,000 |
65 |
4,041,234 |
3,677,220 |
3,192,296 |
+ |
15.2 |
+ |
9.9 |
| 40,000 |
" " |
50,000 |
52 |
2,316,094 |
2,102,710 |
1,922,338 |
+ |
9.4 |
+ |
10.1 |
| 30000 |
" " |
40,000 |
69 |
2,373,463 |
2,180,690 |
2,035,851 |
+ |
7.1 |
+ |
8.8 |
| 20,000 |
" " |
30,000 |
108 |
2,639,946 |
2,424,500 |
2,294,669 |
+ |
5.7 |
+ |
8.9 |
| 15,000 |
" " |
20,000 |
95 |
1,670,100 |
1,544,130 |
1,489,843 |
+ |
3.6 |
+ |
8.2 |
| 10,000 |
" " |
15,000 |
118 |
1,437,448 |
1,325,016 |
1,281,727 |
+ |
3.4 |
+ |
8.5 |
| 5,000 |
" " |
20,000 |
185 |
1,329,771 |
1,192,140 |
1,172,767 |
+ |
1.7 |
+ |
11.5 |
| 4,000 |
" " |
5,000 |
55 |
245,941 |
224,502 |
227,029 |
— |
1.1 |
+ |
9.5 |
| 3,000 |
" " |
4,000 |
49 |
170,966 |
154,389 |
154,051 |
+ |
0.2 |
+ |
10.7 |
| 2,000 |
" " |
3,000 |
48 |
119,768 |
109,499 |
111,405 |
— |
1.7 |
+ |
9.4 |
| Under 2,000 |
30 |
43,869 |
41,521 |
41,991 |
— |
1.1 |
+ |
5.7 |
|
|
|
|
|
|
|
|
|
| Total |
965*
|
35,322,104 |
34,190,187 |
32,933,529 |
+ |
3.8 |
+ |
3.3 |
*
London Administrative County is here reckoned as one area.
The main interest in this table will be found in the last two columns in which are shown the changes in these grades of towns during the pre-war years 1931-39 and the subsequent period since 1939. In the former there appears to be a well marked maximum rate of growth accorded to towns of between 50,000 and 100,000 population with rates of increase for both larger and smaller units which rapidly taper away and are converted to declines at each of the extremes. The pattern of change is similar to that which was recorded for the previous and earlier intercensal periods and was responsible for the suggestion made in the 1931 Report that in provincial centres a figure of between 50,000 and 100,000 roughly marks a limit of effective aggregation beyond which the advantages of further accretion begin to be counterbalanced by increasing disadvantages. Since 1939 the said limit would appear to have been lowered somewhat—the region of 40,000 to 75,000 now being indicated with increases for larger units tapering away even more steeply than before; on the other hand, for the lower categories the former tapering has disappeared and been supplanted by a much more uniform rate of growth throughout, a change which may reflect the growing recognition of the desirability of reducing the former excessive concentrations and the wider dispersal of the population in smaller homogeneous units.
London County and the "Outer Ring."—
In the County of London and the immediately surrounding areas conveniently designated the "Outer Ring" (which together comprise what is customarily known and described as "Greater London" and coincide substantially with the area covered by the City of London and the Metropolitan Police District)3
8,346,137 persons were enumerated, thus accounting for rather less than one-quarter of the urban population or one-fifth of the total population of England and Wales.
TABLE H
| |
1881 |
1891 |
1901 |
1911 |
1921 |
1931 |
1939†
|
1951 |
|---|
| Population:—
|
|
|
|
|
|
|
|
|
| London County |
3,830,297 |
4,227,954 |
4,536,267 |
4,521,685 |
4,484,523 |
4,397,003 |
4,013,400 |
3,348,336 |
| |
|
|
|
|
|
|
|
|
| Outer Ring |
936,364 |
1,405,852 |
2,045,135 |
2,729,673 |
3,003,859 |
3,818,670 |
4,714,600 |
4,997,801 |
| Greater London |
4,766,661 |
5,633,806 |
6,581,402 |
7,251,358 |
7,488,382 |
8,215,673 |
8,728,000 |
8,346,137 |
| |
|
|
|
|
|
|
|
|
Increase (+) or
Decrease (—)
per cent. in
preceding
period:—
|
|
|
|
|
|
|
|
|
| London County |
— |
+ |
10.4 |
+ |
7.3 |
— |
0.3 |
— |
0.8 |
— |
2.0 |
— |
8.7 |
— |
16.6 |
| Outer Ring |
— |
+ |
50.1 |
+ |
45.5 |
+ |
33.5 |
+ |
10.0 |
+ |
27.1 |
+ |
23.5 |
+ |
6.0 |
| Greater London |
— |
+ |
18.2 |
+ |
16.8 |
+ |
10.2 |
+ |
3.3 |
+ |
9.7 |
+ |
6.2 |
— |
4.4 |
| |
|
|
|
|
|
|
|
|
Corresponding
increase (+)
per cent. in
|
|
|
|
|
|
|
|
|
England and
Wales |
— |
+ |
11.7 |
+ |
12.2 |
+ |
10.9 |
+ |
5.0 |
+ |
5.5 |
+ |
3.8 |
+ |
5.5 |
All urban
areas:—
|
— |
+ |
|
+ |
|
+ |
|
+ |
|
+ |
|
+ |
|
+ |
|
| Total growth |
— |
+ |
18.5 |
+ |
19.9 |
+ |
12.4 |
+ |
6.6 |
+ |
6.4 |
+ |
7.0 |
+ |
3.3 |
Self growth
(see Table E) |
— |
+ |
15.4 |
+ |
15.2 |
+ |
11.1 |
+ |
5.2 |
+ |
4.9 |
+ |
3.8 |
+ |
3.3 |
†
Mid-year estimate.
The present total population of the combined area is 130 thousands greater than it was in 1931; the increase, amounting to 1-6 per cent, over the 20 years, is in strong contrast to the 9.7 increase in the preceding 10 years 1921-31 and the even higher rates of all earlier decades back to 1881 other than that of the first war decennium of 1911-21 when it dropped temporarily to 3.2 per cent. The sudden arrest of such substantial and long sustained growth in an area containing so large and important a section of the national population is itself striking, but it is in no way indicative of the vast changes in its population pattern that have taken place as the result of the war and its selection by the enemy as a primary target for the more or less continuous aerial bombardment to which it was subjected.
It was observed in the 1931 Report that the rapid growth of the metropolis prior to the first war was not dissimilar from that of the urban population as a whole, but that, after that war, the subsequent development was concentrated primarily in the South Eastern counties when the rate of growth in the London area rose well above either that of the Provincial towns or of the country as a whole. Concurrently with the total growth, the movement since 1901 had developed a centrifugal tendency leading to a gradual but increasing decline in the central Administrative County to the advantage of the areas in the surrounding "Outer Ring." The general characteristic of the Pre-1931 development continued up to 1939, subject only to some acceleration in the decentralizing process, by which time the Greater London population as a whole reached an estimated total of 8,728,000, the maximum recorded for the area either before or since; at the same time the central administrative county component fell to just above the 4 million level, about 11½ per cent, below its earlier 1901 maximum of 4¼ millions.
After 1939, all orderly development ceased and the population became at once subject, to the massive and alternating tides of evacuation and restoration which characterized the area during the war and which will long be a vivid memory to those who were in any way associated with them. Based at first on anticipations of what the enemy might have in stores they were later more rigorously conditioned by the actual results of the attacks in the diminishing numbers of dwellings fortunate enough to have escaped destruction and still capable of housing their returning occupants. The ultimate result is that the total population in the Greater London area in 1951 is nearly 400,000 fewer (-4.4 per cent.) than it was in 1939 and this despite such partial property restoration as has been possible by the restricted building operations of the post-war period.
Within the County of London alone, the present population of 3,348,336 is 16.6 per cent, below its counterpart of 1939 and more than a million less than it was in 1931, a loss in the 20 years equivalent in magnitude to the entire population of Birmingham, our largest provincial town. The decline has been heaviest, as would be expected, in the central and eastern boroughs which were subject to the enemy's most concentrated attack. The maximum percentage loss since 1931 in a single borough is that of 56.2 per cent, recorded for Stepney, but Shoreditch, Poplar and the City of London itself have all lost more than half their earlier populations and in four other adjacent boroughs the scale of reduction is only nominally less at between 40 and 50 per cent. The outer Boroughs of Woolwich, Lewisham and Hampstead are the only exceptions to the general rule of decline, with modest intercensal increases of 0.6, 3.5 and 6.9 per cent, respectively.
In the "Outer Ring," the details of which are set out in Table IV on pages 39 and 40, the record for the 1931-51 period as a whole is generally one of substantial and widespread growth, though with a very few exceptional declines in areas near the eastern edge of the county. Thirteen of the areas identified in Table IV have more than doubled their populations, the three highest percentage fates of increase being those assigned to Ruislip Northwood U.D. (325.8), Chislehurst and Sidcup U.D. (208.7) and Potters Bar U.D. (200.1).
Large Towns.—
Of the total 965 urban administrative areas within the country, 156 (including the County of London as one district) are now assigned populations in excess of 50,000 persons each. There were 113 such towns in 1931, the considerable increase of 43 in their number being due partly to the ordinary process of growth but in part, on this occasion, to the extensive revision of boundaries under the operation of the Local Government Act of 1929, a feature of which was the compression of the urban population into a smaller number of separate areal units with a consequential raising of their average population content.
Of the areas included in the list of "Large Towns" in 1931, Ashton under Lyne M.B. is the only one which has fallen below the 50,000 limit and is now excluded. The list includes all the county boroughs except Burton upon Trent, Canterbury and Chester.
In Table VI on page 45, the Large Towns are assembled together and arranged in order of their 1951 populations with the 1921, 1931 and 1939 populations within the areas as now constituted shown in adjacent columns.
Of the towns outside the County of London, Birmingham heads the list with a population well above the million mark; by its 10.9 per cent, increase since 1931, it has markedly advanced its lead over Liverpool and Manchester which stand second and third on the list near the three-quarter million point, each having declined by about 8 per cent, during the period. Sheffield and Leeds with half a million population each, rank fourth and fifth respectively.
One hundred and thirteen of the Large Towns record increases in population since 1031 of which increases 13 exceed 100 per cent. and 14 more are between 50 and 100 per cent. On the other hand declines are recorded in 43 towns compared with 25 in the preceding intercensal period, the present record including losses of more than 10 per cent. in ten areas.
The 27 areas with gains in excess of 50 per cent. and the 23 with losses of more than 5 per cent. are as follow:—
| Increases (per cent.)
+ |
|
Decreases (per cent.)
— |
|---|
| Huyton with Roby |
973.0 |
|
West Ham C.B. |
41.9 |
| Ruislip Northwood |
325.8 |
|
London A.C. |
23.8 |
| Chigwell |
216.9 |
|
Rhondda |
21.2 |
| Chislehurst and Sidcup |
208.7 |
|
Salford C.B. |
20.3 |
| Hayes and Harlington |
185.6 |
|
Tottenham M.B. |
19.5 |
| Bexley M.B. |
171.9 |
|
Leyton M.B. |
18.0 |
| Solihull |
167.9 |
|
East Ham C.B. |
15.1 |
| Hornchurch |
164.4 |
|
Mertyhyr Tydfil C.B. |
14.1 |
| Orpington |
145.0 |
|
Oldham C.B. |
13.6 |
| Romford M.B. |
132.5 |
|
Burnley C.B. |
13.5 |
| Harrow |
127.1 |
|
Great Yarmouth C.B. |
10.0 |
| Carshalton |
119.7 |
|
Smethwick C.B. |
9.5 |
| Surbiton M.B. |
101.1 |
|
Blackburn C.B. |
9.4 |
| Wembley M.B. |
99.7 |
|
Walthamstow M.B. |
9.0 |
| Slough M.B. |
99.7 |
|
Manchester C.B. |
8.2 |
| Epsom and Ewell M.B. |
93.2 |
|
Rochdale C.B. |
8.2 |
| Merton and Morden |
81.0 |
|
Liverpool C.B. |
7.8 |
| Uxbridge M.B. |
75.4 |
|
Gateshead C.B. |
7.7 |
| Sutton and Cheam M.B. |
66.8 |
|
Portsmouth C.B. |
7.5 |
| Enfield |
63.0 |
|
Brentford and Chiswick M.B. |
6.1 |
| Scunthorp M.B |
60.7 |
|
Birkenhead C.B |
6.0 |
| Ealing M.B. |
60.4 |
|
South Shields |
5.8 |
| Coulsden and Purely |
60.2 |
|
Bolton |
5.7 |
| Esher |
58.0 |
|
|
|
| Luton M.B. |
56.6 |
|
|
|
| Barking M.B. |
52.5 |
|
|
|
| Gosport M.B. |
51.5 |
|
|
|
Of the 27 areas with increases in excess of 50 per cent, it may be noted that no less than 22 are within Greater London or within correspondingly easy travelling distance of the centre, a degree of concentration which extends in little less degree to the areas below the 50 per cent, increase mark. Amongst the largest increases in this region, the U.D. of Chigwell ranks with those of Ruislip Northwood and Chislehurst and Sidcup already mentioned, as having more than trebled their 1931 populations and these are followed by eight others in which the population has been doubled. In most of them the growth since the outbreak of war has been relatively high, as might be expected from their absorption of population from the heavily depleted central areas of the Metropolis; but in general the rates of increase were far higher in the years prior to 1939, so that the war, including its aftermath of shortages and restraints, must be regarded in general as having acted as a powerful brake on the momentum of the earlier growth.
Of the other five areas, Huyton with Roby, Solihull, and Gosport are adjacent to large over-populated cities; Scunthorpe's rapid development is associated with the expansion in the steel industry and Luton is on the fringe of the London area. Of towns approaching the 50 per cent, increase mark may be mentioned Coventry,, which gave its name to the particularly vicious type of local enemy attack of which it was a forerunner, and in which, notwithstanding its great physical damage, the population has increased by 45.0 per cent, since 1931, or by 17.4 per cent.—three times the national rate—since 1939.
Of the areas with declining populations away from the Metropolis, Rhondda U.D. heads the list, as it did in 1931, with a present loss of 21.2 per cent, following one of 13.1 per cent, on the preceding occasion; the neighbouring County Borough of Merthyr Tydfil is also prominent with successive losses of 11.3 and 14.1 per cent, in the two periods. Amongst the decreases in excess of 5 per cent, no less than eight are in respect of county boroughs in Lancashire, five of them being in continuation of losses in the preceding period; their experience generally is in accord with the decline in the textile areas of the north-west which has been typical of the period since the first world war. In a majority of the areas, the incidence of the loss was higher in the years preceding 1939, the war and post-war influences—as in the case of the growing areas—appearing to have acted as a restraint upon the earlier tendencies rather than otherwise.
As a measure of caution it should be remarked that, while the serial census records provide reliable evidence of growth or otherwise of various types of area, figures for individual areas or individual occasions must be, interpreted in the light of any special conditions attending the several enumerations. The natural growth of towns or the amelioration of overcrowding in their denser central portions frequently involves encroachment into suburbs. outside, existing administrative boundaries; the latter are modified from time to time to give effect to the altered circumstances, but such changes usually take place at infrequent intervals and often lag behind the motivating increase in population, a condition which may be of significance at the present time in view of the general suspension of boundary changes which has been in operation since 1939.
Conurbations.—
In the case of the Metropolis, the Administrative County of London is, from a population point of view, little more than the central portion of an otherwise continuous and much bigger urban area, of a total pattern the characteristics of which are mainly those of a single community with a large and continuous interchange of individuals between its several parts. It has long been recognized that the population features of the whole area are not adequately reflected by those of the residents in its central section and for some decades now it has been customary in the presentation of population statistics to treat the Metropolis in terms of the extended area known as Greater London.
For a long time, too, a need has been felt for the adequate statistical treatment of the similar aggregations of population in the provinces, but there has been no general consensus of opinion either upon the number of the concentrations or "conurbations" that should so be treated or upon the exact composition of each. In 1950 the Interdepartmental Committee on Social and Economic Research (which includes academic as well as Departmental members and is serviced by the General Register Office) took the matter into consideration and prepared provisional suggestions for the six major groupings in Great Britain outside London. In the result agreement was reached, under the aegis of the Committee and the Central Statistical Office, on the conurbations to be used for the presentation of official statistics generally. The groupings are defined in terms of complete local authority areas. The constitutions and the census populations of the five conurbations in England and Wales are set out in Table IV; the record is summarized in Table J.
TABLE J
5 Provincial
Conurbations |
Population |
Increase (+) or Decrease (—)
Per cent. |
|---|
| 1921 |
1931 |
1939*
|
1951 |
1921-31 |
1931-39 |
1939-51 |
|---|
| S.E. Lancashire |
2,361,164 |
2,426,922 |
2,421,308 |
2,421,011 |
+ |
2.8 |
— |
0.2 |
— |
0.0 |
| W. Midlands |
1,773,395 |
1,932,980 |
2,078,733 |
2,236,723 |
+ |
9.0 |
+ |
7.5 |
+ |
7.6 |
| W. Yorkshire |
1,613,490 |
1,655,419 |
1,658,144 |
1,692,190 |
+ |
2.6 |
+ |
0.2 |
+ |
2.1 |
| Merseyside |
1,263,326 |
1,346,662 |
1,356,836 |
1,382,244 |
+ |
6.6 |
+ |
0.8 |
+ |
1.9 |
| Tyneside |
815,637 |
827,086 |
825,390 |
835,332 |
+ |
1.4 |
— |
0.2 |
+ |
1.2 |
*
Mid-year estimate.
It will be seen that the conurbations as identified and defined are all large units with populations approaching or in excess of a million persons in each case. Table IV shows that they consist of entire county boroughs or county districts numbering—in the above-named order—53, 24, 33, 12 and 13 respectively; and that among the 53 of S.E. Lancashire two rural districts are included. They will be generally associated with the more familiar large towns which represent their respective nuclei, viz.: (1) Manchester, (2) Birmingham, (3) Leeds and Bradford, (4) Liverpool, and (5) Newcastle upon Tyne.
Table J indicates that in three of the conurbations, S.E. Lancashire, W. Yorkshire and Tyneside, the population has been virtually stationary for the past 30 years and that in Merseyside a like condition applies in respect of the past 20 years, such movement as is recorded contrasting in this respect with the more steady growths of 5.5, 3.8 and 5.5 per cent, in the country at large during the successive periods identified. The W. Midlands conurbation on the other hand stands apart in recording substantial and continuous growth throughout the 30 years with successive increases considerably in excess of their national counterparts.
New Towns.—
In Appendix A on page 50 are set out the populations and areal constitutions of 12 projected New Towns as designated and delineated in Orders made under Section i of the New Towns Act, 1946.
The 1951 populations enumerated within the new town boundaries are summarized below from which it will be seen that from the point of view of population content they are at present comparatively small units, only two of them containing more than 20,000 persons, viz. Basildon and Hemel Hempstead, and ranging downwards therefrom to a mere handful in Peterlee:—
Persons |
|
|
Persons |
| Aycliffe |
594 |
|
Harlow |
5,828 |
| Basildon |
24,566 |
|
Hatfield |
9.258 |
| Bracknell |
5,142 |
|
Hemel Hempstead |
22,064 |
| Corby |
16,736 |
|
Peterlee |
298 |
| Crawley |
10,701 |
|
Stevenage |
7,312 |
| Cwmbran |
13,659 |
|
Welwyn |
18,786 |
In their present form some are little more than assemblies of adjacent parts of existing administrative areas from which they will be ultimately severed when they acquire a separate and unified existence of their own, until when such advance development and planning as is now proceeding is being undertaken by the several Development Corporations set up under the Act. The major population changes have yet to come and the main interest in the present figures will thus be in the record they provide of the rudimentary nuclei of future model communities organized and planned from the outset in accordance with deliberate functional principles.
Sexes.—
There were 1,696,550 more females than males enumerated at the 1951 Census, a female preponderance negligibly greater than the corresponding female preponderance of 1,686 thousands enumerated in 1931. Expressed in terms of proportions, the present excess represents a ratio of 1,081 females per 1,000 males, which may be compared with 1,096 in 1921 immediately after the first world war, 1,088 in 1931, and 1,081 (estimated) in 1939, the combined events of the recent war and post-war periods having thus arrested the declining trend in the ratios without reversing it. In this respect the recent period contrasts with that of the 1911-21 decennium, embracing the first world war, during which the female/male proportion increased from 1,068 to 1,096.
The 1951 proportion of 1,081 females per 1,000 males is remarkably higher than those of all earlier Censuses up to 1911, and must probably be accepted as indicative of a permanent change associated generally with the ageing of the population and the growing numbers at the older ages at which surviving females, by reason of their lighter mortality, increasingly outnumber men with proportions rising to 2 to I and more at the extreme ages.
Comparative figures for the years 1921, 1931 and 1951, both in respect of the country as a whole and of various divisions of the country are shown in Table K.
TABLE K.—Proportion of Females to Males (per thousand)
| |
1921 |
1931 |
1951 |
|
1921 |
1931 |
1951 |
|---|
| England and Wales
|
1,096
|
1,088
|
1,081
|
Counties with highest proportion
of females:—
|
|
|
|
| |
|
|
|
Sussex, East |
1,302 |
1,287 |
1,280 |
| All Urban Areas |
1,113 |
1,106 |
1,106 |
Sussex, West |
1,201 |
1,203 |
1,234 |
| All Rural Areas |
1,020 |
1,009 |
983 |
Caernarvonshire |
1,184 |
1,130 |
1,167 |
| |
|
|
|
Surrey |
1,188 |
1,171 |
1,157 |
| Standard Regions—
|
|
|
|
Wight, Isle of |
1,249 |
1,191 |
1,146 |
| Northern |
1,022 |
1,021 |
1,039 |
London |
1,165 |
1,151 |
1,135 |
| East and West Ridings |
1,079 |
1,074 |
1,083 |
Cardiganshire |
1,187 |
1,170 |
1,130 |
| North Western |
1,113 |
1,115 |
1,108 |
Somersetshire |
1,176 |
1,161 |
1,125 |
| North Midland |
1,057 |
1,047 |
1,038 |
Middlesex |
1,166 |
1,132 |
1,123 |
| Midland |
1,067 |
1,064 |
1,041 |
Westmorland |
1,174 |
1,152 |
1,123 |
| Eastern |
1,119 |
1,069 |
1,051 |
Lancashire |
1,112 |
1,114 |
1,111 |
| London and South Eastern |
1,154 |
1,142 |
1,136 |
Devonshire |
1,137 |
1,119 |
1,105 |
| Southern |
1,092 |
1,074 |
1,049 |
Hertfordshire |
1,140 |
1,115 |
1,102 |
| South Western |
1,136 |
1,116 |
1,071 |
Kent |
1,106 |
1,087 |
1,102 |
| Wales |
997 |
1,004 |
1,045 |
Cornwall |
1,175 |
1,136 |
1,099 |
| |
|
|
|
|
|
|
|
| |
|
|
|
Counties with lowest proportion
of females:—
|
|
|
|
| |
|
|
|
Lincolnshire (parts of Lindsey) |
1,040 |
1,027 |
1,011 |
| |
|
|
|
Montgomeryshire |
1,013 |
1,017 |
1,009 |
| |
|
|
|
Ely, Isle of |
1,027 |
986 |
1,007 |
| |
|
|
|
Bedfordshire |
1,102 |
1,072 |
1,007 |
| |
|
|
|
Oxfordshire |
1,100 |
1,047 |
1,002 |
| |
|
|
|
Yorkshire (North Riding) |
1,048 |
1,015 |
990 |
| |
|
|
|
Merionethshire |
1,143 |
1,063 |
980 |
| |
|
|
|
Radnorshire |
1,054 |
1,018 |
979 |
| |
|
|
|
Brecknockshire |
973 |
972 |
976 |
| |
|
|
|
Suffolk, West |
1,048 |
1,024 |
946 |
| |
|
|
|
Shropshire |
1,033 |
1,025 |
937 |
| |
|
|
|
Huntingdonshire |
1,047 |
1,023 |
926 |
| |
|
|
|
Lincolnshire (parts of Kesteven) |
983 |
981 |
920 |
| |
|
|
|
Rutlandshire |
1,024 |
1,060 |
916 |
| |
|
|
|
Wiltshire |
1,016 |
1,004 |
898 |
The sex distribution differs widely in different parts of the country. This, however, is not a novel feature and the relative positions of the several areas have not radically altered in the course of the past 20 years, areas with the higher and lower proportions in 1931 generally retaining such positions though with minor changes in their individual ranking. Within the regions as now identified there has been a slight narrowing in the range of variation, the higher proportions having declined and the lower risen; the greatest preponderance of females continues to be found in London and South Eastern, ranking it well above all the others; in Wales on the other hand, which ranked tenth and lowest in 1931, the largest increase in the ratio is recorded raising it above the Northern and the two Midland regions. In the separate counties the range of variation has increased rather than contracted, there now being ten counties in which males are in excess of females as against only five in 1931; amongst those with the highest proportion of females, the Southern counties continue their prominence with their special attractiveness to the retired and elderly classes, and also the Metropolitan counties with the favourable employment opportunities they offer to women. The counties at the other extreme, where females are outnumbered by males, are almost unexceptionally rural in character, their normally low ratios having no doubt increased since 1931 by the loss of women diverted to meet the increased demands in the industrial production of the war and post-war years.
1
The corresponding density for Great Britain as a whole is 550 persons per sq. mile.
2
An explanation of the measurement of population in terms of its reproductive capacity was set out in Appendix III of the Civil Text of the Registrar General's Statistical Review for 1940-1945.
3
i.e., excluding the parishes of Northaw (Hatfield R.D.) and Aldenham (Watford R.D.).
Previous Selection